Blog
Marketer’s Guide to Understanding Statistics
This article provides a detailed marketer’s guide to understanding statistics. It provides more information, detail, and context to the article CHAPTER 1: Conversion Rate Optimization Secrets, one of four articles that lay out the Frictionless Commerce Conversion Rate Optimization philosophy.
This marketer’s guide to understanding statistics isn’t for technical people. It doesn’t take a Ph.D., access to a supercomputer or a mathematician on speed dial to figure it out.
We put this together to demystify statistics for marketers. Like it or not, marketers can’t avoid or ignore statistics. So instead, let’s use them. Let’s understand the important ones and use them to build better marketing.
Here’s What You Can Expect From This Article
The Number One, Most Important Statistical Concept for Marketers

Forget the textbooks filled with esoteric concepts you will never use and probably never even understand. Just learn what statistical significance is. Understanding this concept will immediately make your testing process 2.3x better.
So, what is statistical significance?
Statistical significance is the likelihood that the difference in conversion rates between a given two variations is not due to random chance.
Statistical significance lets you know whether the result of your marketing experiment was a random fluke or a meaningful conclusion.
For a more detailed explanation of statistical significance, check out this article.
Flipping Coins: Helping Marketers Understand Statistics
Imagine you run an experiment where you toss a coin three times. Say you got three heads in a row. You’re probably not going to think this coin always lands on heads. You know this happens occasionally (about 1 in 8 times).
So it’s easy to see how this experiment is not statistically significant.
Of course, as your sample got bigger— say you flipped the coin 20 times, and every time it landed on heads— you might start to think there was something seriously wrong with that coin.
When you run A/B tests, you want to be certain that you find the winning idea. Look for at least 95% certainty that an idea is a winner.)
You see, our brains are bad at making predictions. We can’t trust them (seriously, we can’t trust our brains).
But I’m a marketer, so I’ll say something most people won’t: there is nothing wrong with instincts; in fact, following instincts is a central feature of how we, as a conversion optimization agency, design experiments.
Don’t let the technical people convince you that the marketing instincts you’ve honed through hundreds of hours of practice aren’t valuable. They are.
So Why Run Tests at All?
We run tests because the statistical analysis can prevent us from drawing conclusions that could have disastrous business implications.
I’m sure you’ve seen case studies that make claims like this: “minor site tweaks led to 30% conversion rate improvements.” A lot of the time those results are not statistically significant. Usually, the marketer ignores the fundamental principles that you have learned here.
My job is to prevent you from making such mistakes.
Understanding Statistical Significance
Let’s say you are running two Facebook ads that lead to two distinct landing pages. As a marketer, your job is to understand which ad is better so you can stop spending on the poor performer and dedicate your entire budget to the winning formula.
You track your performance every hour.
| Time | Ad Shown | New Visitors | Buying Status |
| 1:00 | Ad 1 | 1 | Didn’t Buy |
| 1:00 | Ad 2 | 1 | Bought |
| 2:00 | Ad 1 | 1 | Didn’t Buy |
| 2:00 | Ad 2 | 1 | Didn’t Buy |
| 3:00 | Ad 1 | 1 | Didn’t Buy |
| 3:00 | Ad 2 | 1 | Bought |
It might look like there is a pattern, but in reality, these results are random. Just like our coin-tossing experiment.
But, what an A/B testing tool like VWO does is take numbers and plot them across a probability distribution curve like this:
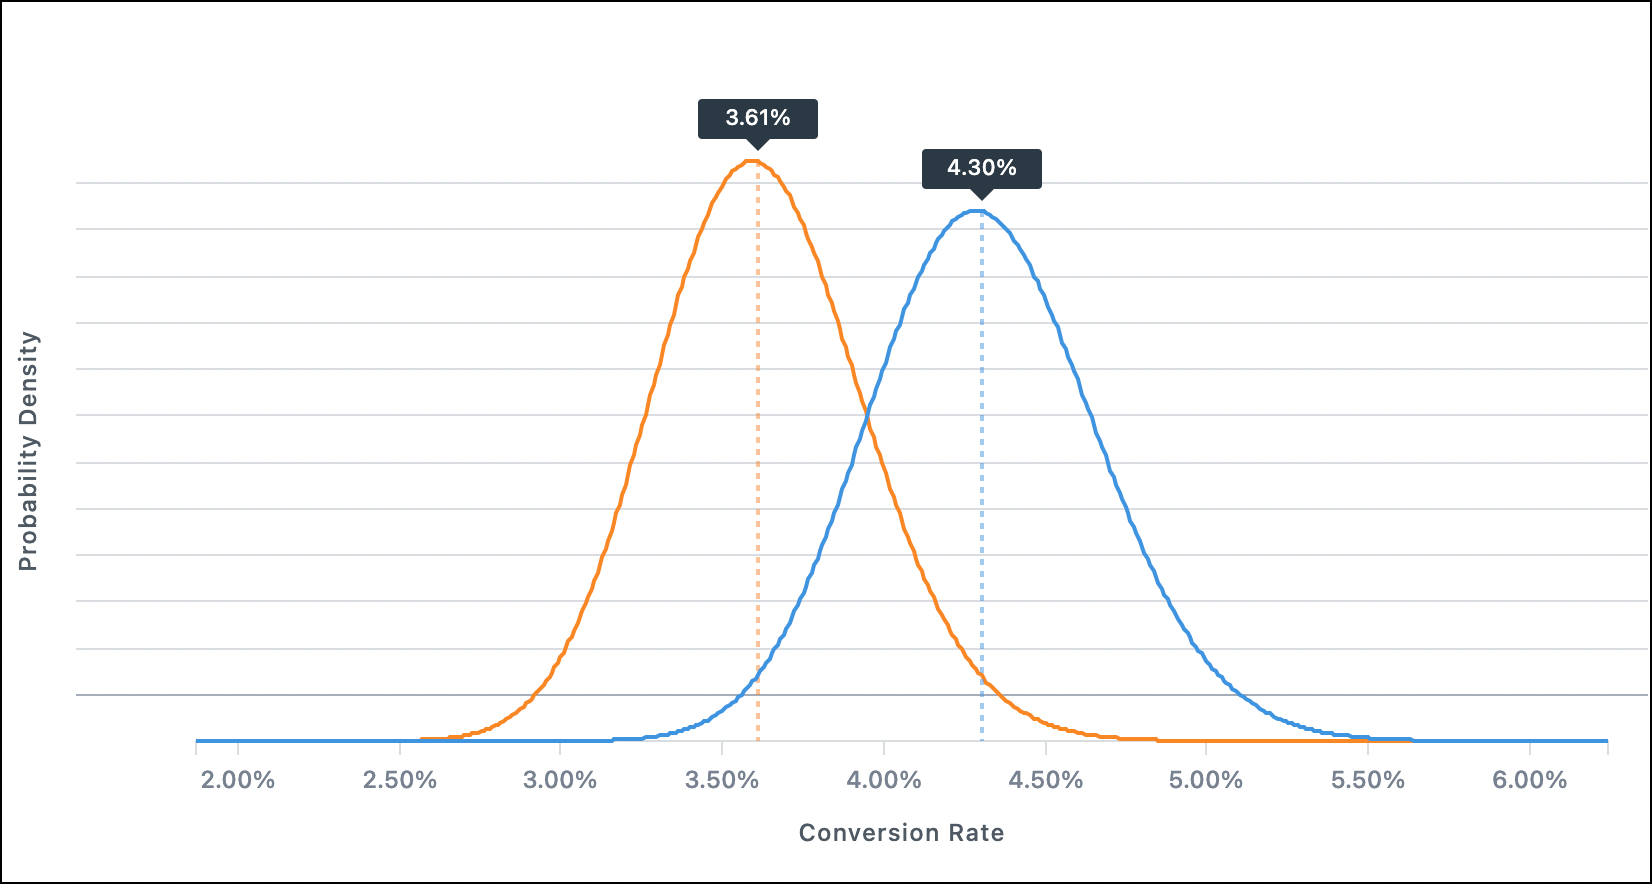
Testing tools compare the performance of those two ads to see if the difference in their performance is statistically significant.
The testing tool considers several signals (how long the test runs, how many conversions occur, and others). Once the tool determines a significance level of 95%, the highest-performing variant is declared the winner.
I know this is a simple explanation. But I’m a marketer and I don’t need to understand terms like standard deviation to do my job because the testing tool has been calibrated to do that for me.
I rely on my watch to tell me the time. I don’t need to know how it calculates that to be able to use it.
Two Statistical Levers
When it comes to A/B Testing, there are two main levers you can pull:
- How long the test runs.
- The contrast between test ideas.
Let your testing tool determine how long your test runs. You want enough data to reach a 95% confidence level. That’s what you need to declare a winner. I just let it run for the longest time possible (always two weeks or more).
What I do control is the contrast between ideas tested. This is an important detail.
In the image above, there are two curves. This is how a testing tool compares two ideas.
To get a conclusive result for your test, make sure there is a significant contrast between ideas. If the differences between the ideas are small we will need a lot more time for the test to collect data.
It’s like taste-testing sugar water where the difference in sugar concentration between the two glasses is very little. To know which batch is truly sweeter you will need to taste both glasses many times because it will be hard for your tongue to pick up the difference between sweet and slightly sweeter.

But if I asked you to tell between sugar water and salt water, you could do that on the first sip. The contrast is massive.
Incorporate the same type of contrast when you test ideas. It will help the testing tool declare a winner much faster.
Test, Test, Test
Then run your test. A core component of the Frictionless Commerce philosophy is to iterate quickly. We want to create the most significant impact, in the shortest amount of time.
We create contrasting ideas using nine truths about online shoppers. Follow the links to learn more.
Next Steps
Now that we’ve got the heavy topic of statistics out of the way let’s look at some fascinating CRO facts.